A Nonzero Mutation Rate is Positively Selected For Under Changing Fitness Function
Abstract
Several academic papers and Richard Dawkins’ “The Selfish Gene” claim that the ideal mutation rate among replicators is zero. This paper tests whether this holds under a fitness function that changes across generations. Two experiments using JavaScript objects as replicators were conducted. The first, with a static fitness function, led to a mutation rate approaching zero. In contrast, the second, with a dynamic fitness function, showed a mutation rate that remained significantly above zero over 20,000 generations.
Introduction
Richard Dawkin’s 1976 book The Selfish Gene introduced the idea of a replicator. A replicator is an entity that can make copies of itself, transmitting information or structure to subsequent generations. DNA is a replicator, as are languages, religions, and ideas.
Much like animals, replicators cannot be studied as a whole because both are abstract classes of actual things. There is no “animal” nor “replicator” which can represent all of the beings that are instances of animal or replicator. Nonetheless, rules might be discovered which hold true for all instances that belong within that class.
One such rule, proposed in The Selfish Gene by Dawkin’s himself, is that replicators try to copy themselves perfectly. Here is a quote from that book:
…Although evolution may seem, in some vague sense, a ‘good thing’, especially since we are the product of it, nothing actually ‘wants’ to evolve. Evolution is something that happens, willy-nilly, in spite of all the efforts of the replicators (and nowadays of the genes) to prevent it happening.
It is this idea that is under study in this paper. If it were true, replicators with lower mutation rates would survive better under any and all circumstances.
In order to disprove this, we therefore only need to create one set of circumstances in which this does not hold.
Hypothesis
If the fitness function changes across generations, then a nonzero mutation rate will be selected for.
Fitness is here used to mean the ability to survive in the environment, as in “the survival of the fittest.” This departs from the use of the word fitness to describe the success of the replicator in becoming more prevalent within a population. This is because the success of each gene is the target of study.
Such a circumstance, in which each generation is judged in a slightly different way than the previous one, arises for many real world replicators. Climatic changes or weather patterns might produce different temperatures or rainfall for a certain generation than the previous. Seeds carried by birds from one location to another might find a different soil type or climate than the one faced by it’s parent. Changes in culture and technology place different uses on a language.
If a single chain of replicators were shown to evolve a non-zero mutation rate under changing circumstances of selection, then it would not prove that non-zero mutation rate is selected for in all cases in which circumstances change across generations, but it would open the door to that possibility and advance our understanding of the dynamics and behaviors of replicators.
Experiment Design
The environment used was a JavaScript runtime, as it allows for manipulation of the fitness function, and precise control over the experiment.
Notation: Because the experiment is operating within a JavaScript runtime, many of the parameters under study are JavaScript Numbers, and a notation for such is useful. Let represent the set of all values that a JavaScript Number can take, excluding “NaN” (Not-a-Number). That is, all 64-bit floating point numbers and .
The replicators under study are JavaScript Objects which are to be called “froigs”, (an allusion to frogs). Based on a stimulus x, with , a froig will output an action y with . The action based on any stimulus is deterministic, and is determined by the froig’s “DNA”.
The DNA is an array of 101 “genes”, (a gene being a JavasScript Number). The first 100 numbers encode deterministically for an action based on a stimulus, and the last gene in the DNA encodes for the mutation rate, denoted . If is the DNA of a froig, we can write . Each encodes for the action to be taken given stimulus .
A froig can clone itself, which qualifies froigs as replicators. During cloning, each gene is copied into a new array, plus some random number with . Each gene in the froig’s DNA is under this mutation rate, including the gene encoding for mutation rate. Thus, mutation rate will be one of the traits under active selection.
A froig only lives for 1 generation. Each of the top 50th percentile froigs get to make 2 copies of itself, and the bottom 50th percentile dies without reproductive success.
Genes indexed 0 through 99 are the ones on which fitness is determined, with gene 100 only playing a role in the cloning process. The fitness will be determined by taking the square of the difference between an expected value function and a froig’s action at each of 100 stimuli in the set . In math notation:
Let be the DNA of a froig, with . Let be the the expected value function. Let be the decoding function that decodes from a gene into an action.
The population was 200. A froig only lives for 1 generation. In the first generation, and each subsequent one, the fitness of each member of the population is calculated. Each of the top 50th percentile froigs makes 2 copies of itself, and the bottom 50th percentile dies without reproductive success.
An elongated sine wave having a period of 100 was used in this experiment for the expected value function. The hypothesis is tested most easily with a bounded and continuous expected function. Sine was chosen from among all such functions not only for its simplicity and familiarity, but also the ability to be deformed continuously while keeping the range of the derivative static.
Two experiments were conducted over a period of 20,000 generations. In the first, the expected value function was not changed with time. This serves as a control experiment. In the second, the fitness function will go through 2 periods of the expected sine function across those 20,000 generations. Over 10,000 generations the expected value for each stimulus will do a complete cycle of being expected between -1 and 1.
For each generation, the froig with the lowest error from the expected value function was named as the “alpha” of that generation.
At each generation, four data points were logged:
- Population average of total error per froig
- Alpha total error
- Population average mutation rate
- Alpha mutation rate
Results
All data collected can be found in these folders: experiment 1 and experiment 2. I do not recommend looking at these, just keep reading.
Experiment 1: Static Fitness Function
The froig’s fitness was determined by the proximity of their actions to:
The population of 200 get closer to this expected function over the generations. Data was collected across 20,000 generations.
Here is what the population looks like at a few sample generations. The expected function is shown as a black line. The actions of each of the froigs are shown as bars from the baseline of 0. Each froig action is displayed with a transparent white, so the strong white regions are where many froigs have their outputs stack up, and lighter white regions might be one or only a few froigs having an output right there.
Generation 100  | Generation 1000 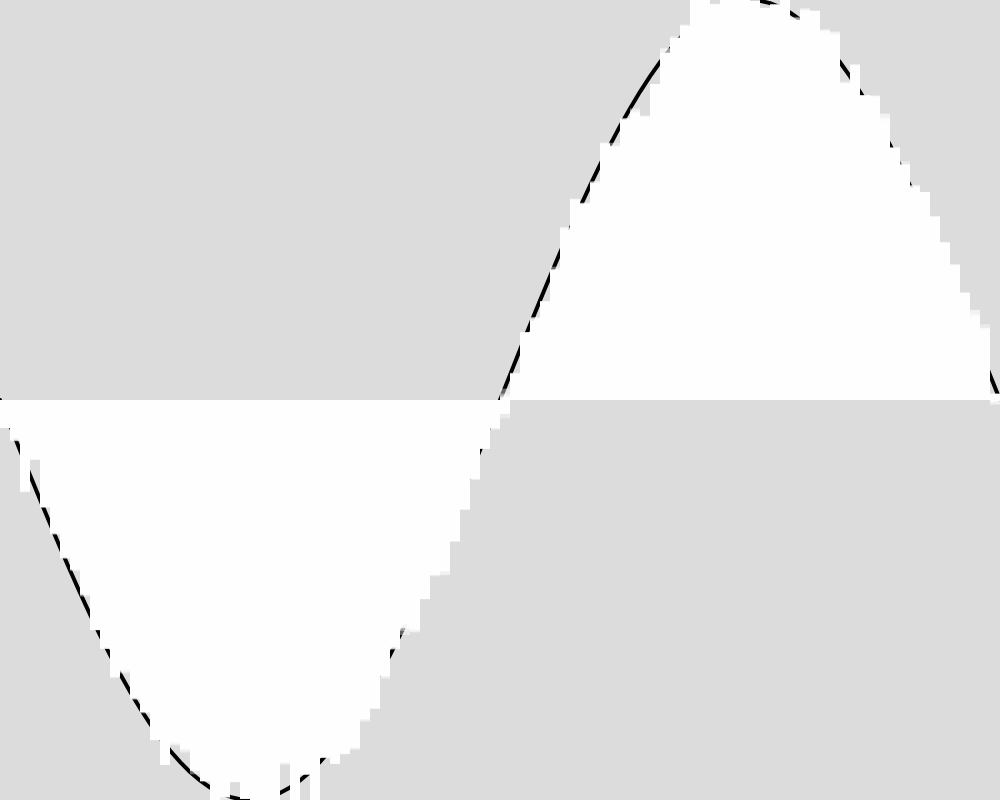 |
|---|---|
Generation 5000 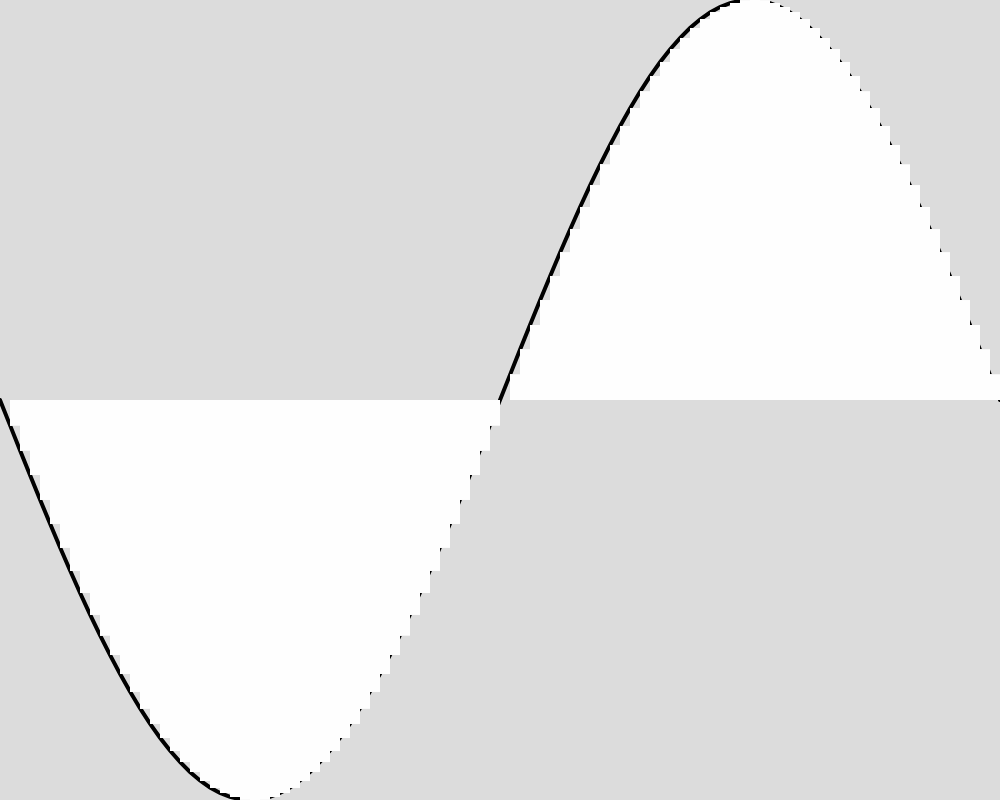 | Generation 20000 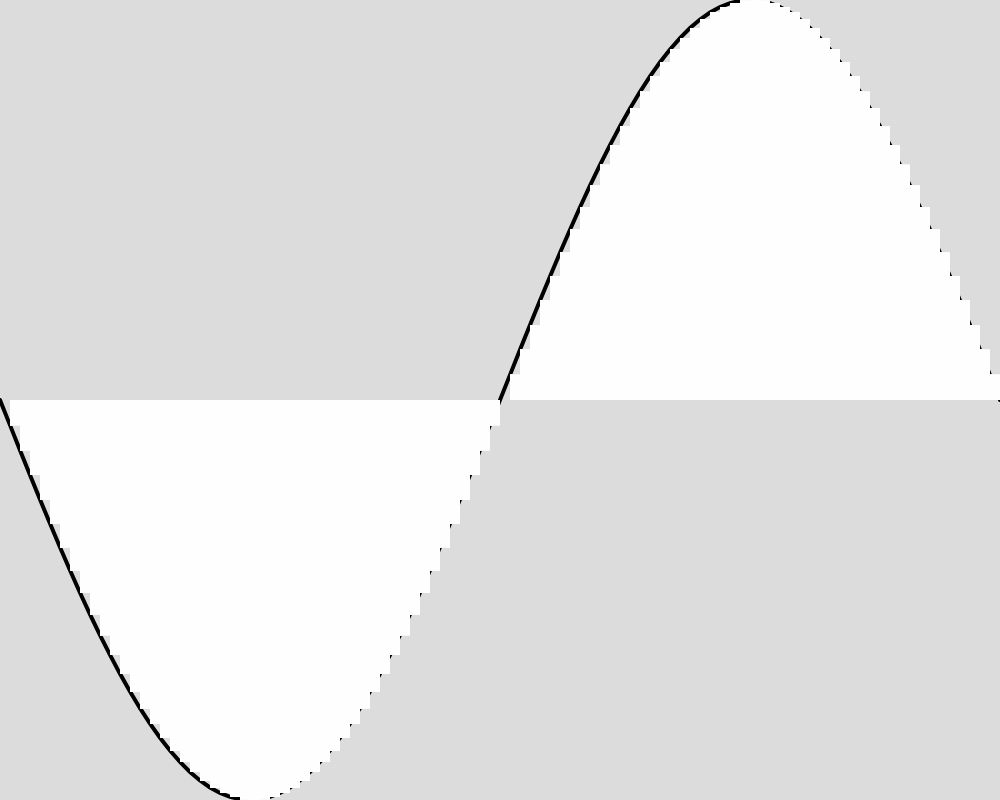 |
These images reveal that the population converges quite rapidly to the expected function, matching it almost exactly by generation 5000. An image for each 100 generations can be found in the data folder for this experiment.
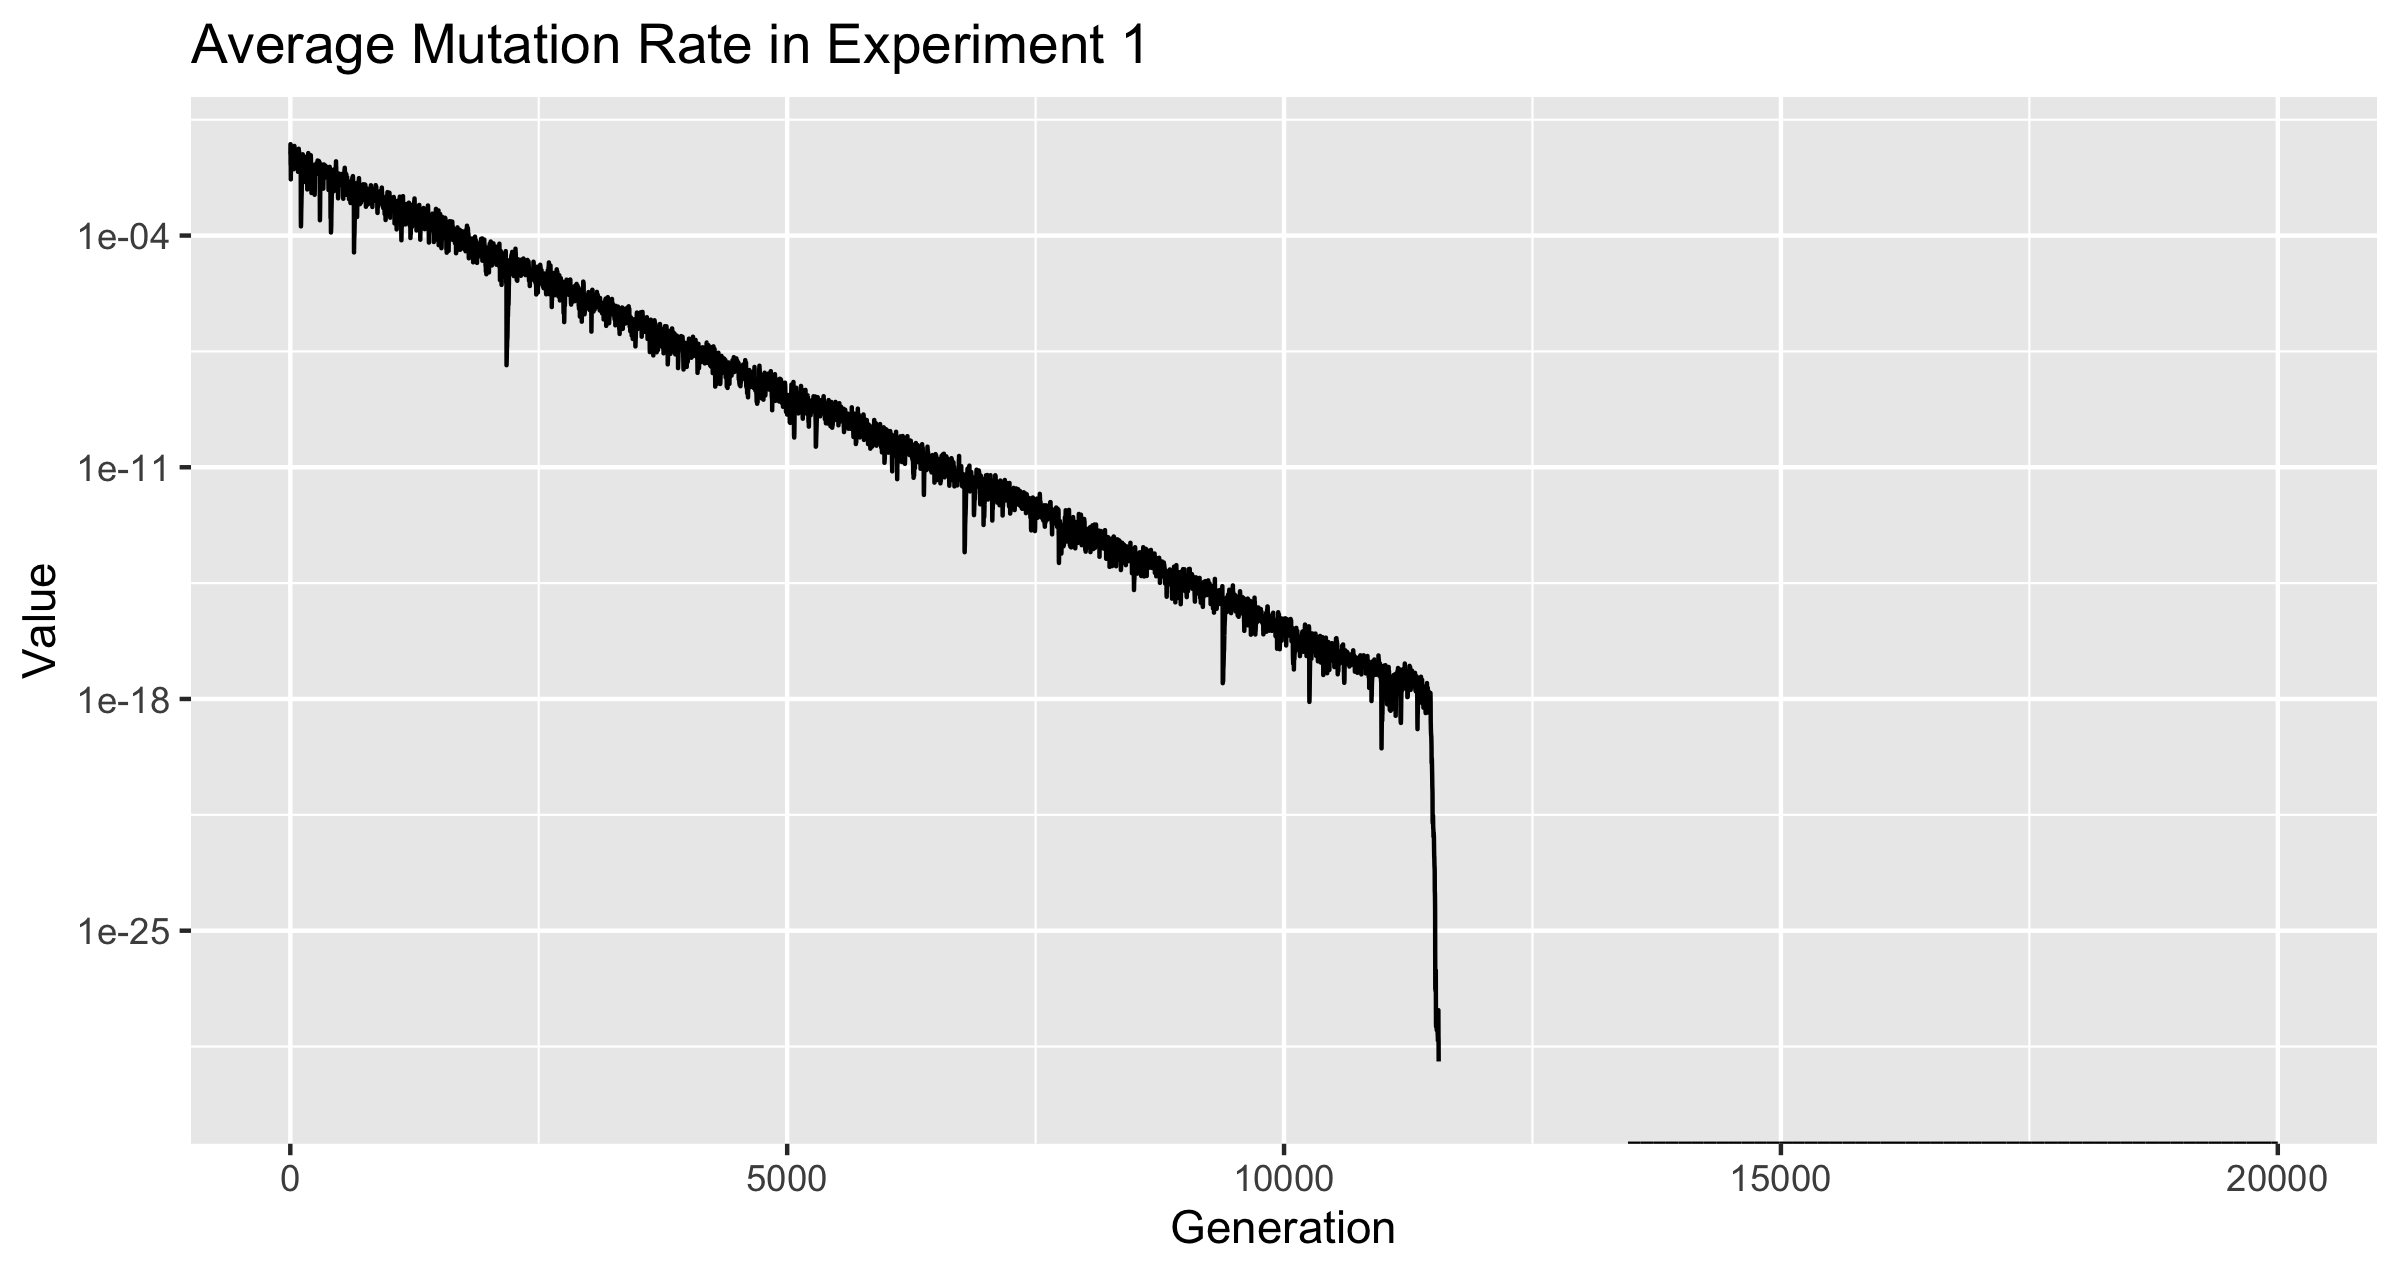
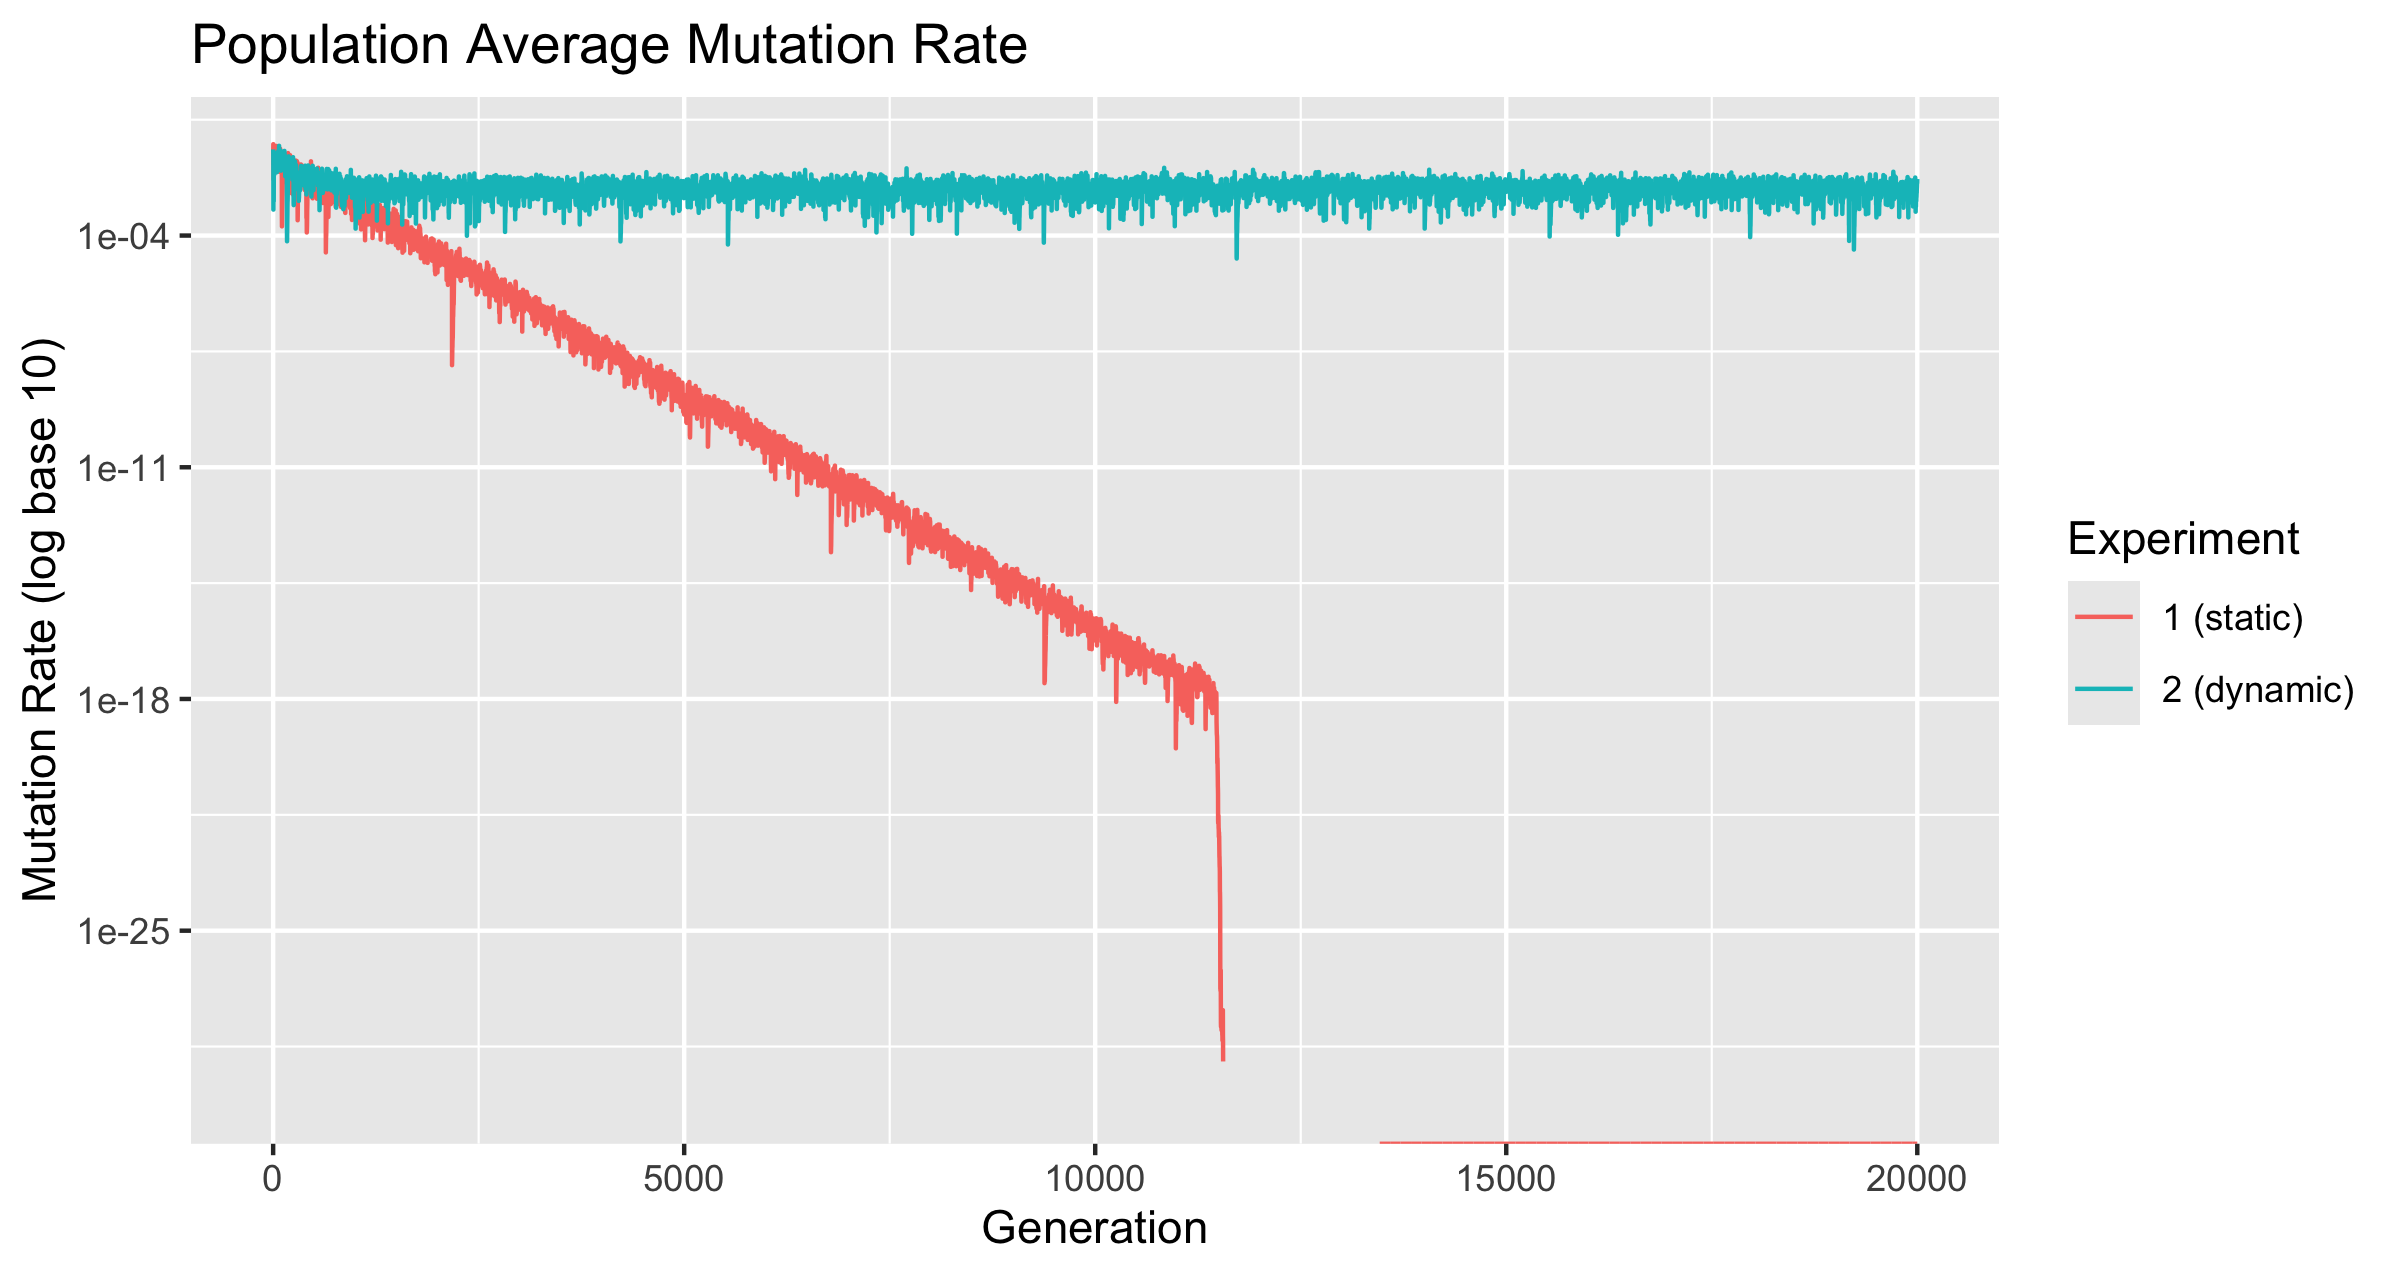
Note: The y-axis for figure 1 is limited to for readability, as the mutation rate dropped to 0, and displaying this makes the rest of it unreadable. The discontinuity of the line is an effect of the graphing software, not the data.
The Mutation Rate dropped to zero. It is not known when or if all froigs in the population hit zero mutation rate, as only the mutation rate of the average across the population and the alpha were tracked. Table 1 shows the changes across generations at the point which the .
Table 1
| Generation | Average Mutation Rate |
|---|---|
| 13448 | 3.5e-323 |
| 13449 | 1.5e-323 |
| 13451 | 0 |
| 13452 | 5e-324 |
| 13454 | 1e-323 |
| 13457 | 5e-324 |
| 13458 | 0 |
| 13459 | 5e-324 |
| 13460 | 0 |
Generations in which the average value did not change are omitted from table 1
Note that is the smallest positive non-zero number representable in JavaScript. Thus the fluctuations between and between generations 13451 and 1460 indicate that froigs with mutation rate above 0 were somewhat successful. 13451 was the first generation at which average mutation rate of 0 was reached, and the average mutation rate stayed at zero from 13460 throughout the remainder of the experiment, which was over 6000 more generations.
This aligns with the claim made by Dawkins, and provides a valid example of “as-small-as-possible” mutation rate being selected for.
The average mutation rate dropped rapidly after reaching . It is notable that the last generation which had an average mutation rate greater than was generation 11,474. The best fitness ever achieved was achieved just a few generations later at generation 11,505, so this is likely the primary driver of that sharp drop. As discussed above, the average mutation rate did not hit 0 for the first time until generation 13,451, so even though this drop looks and is drastic, it too place over nearly 2000 generations.
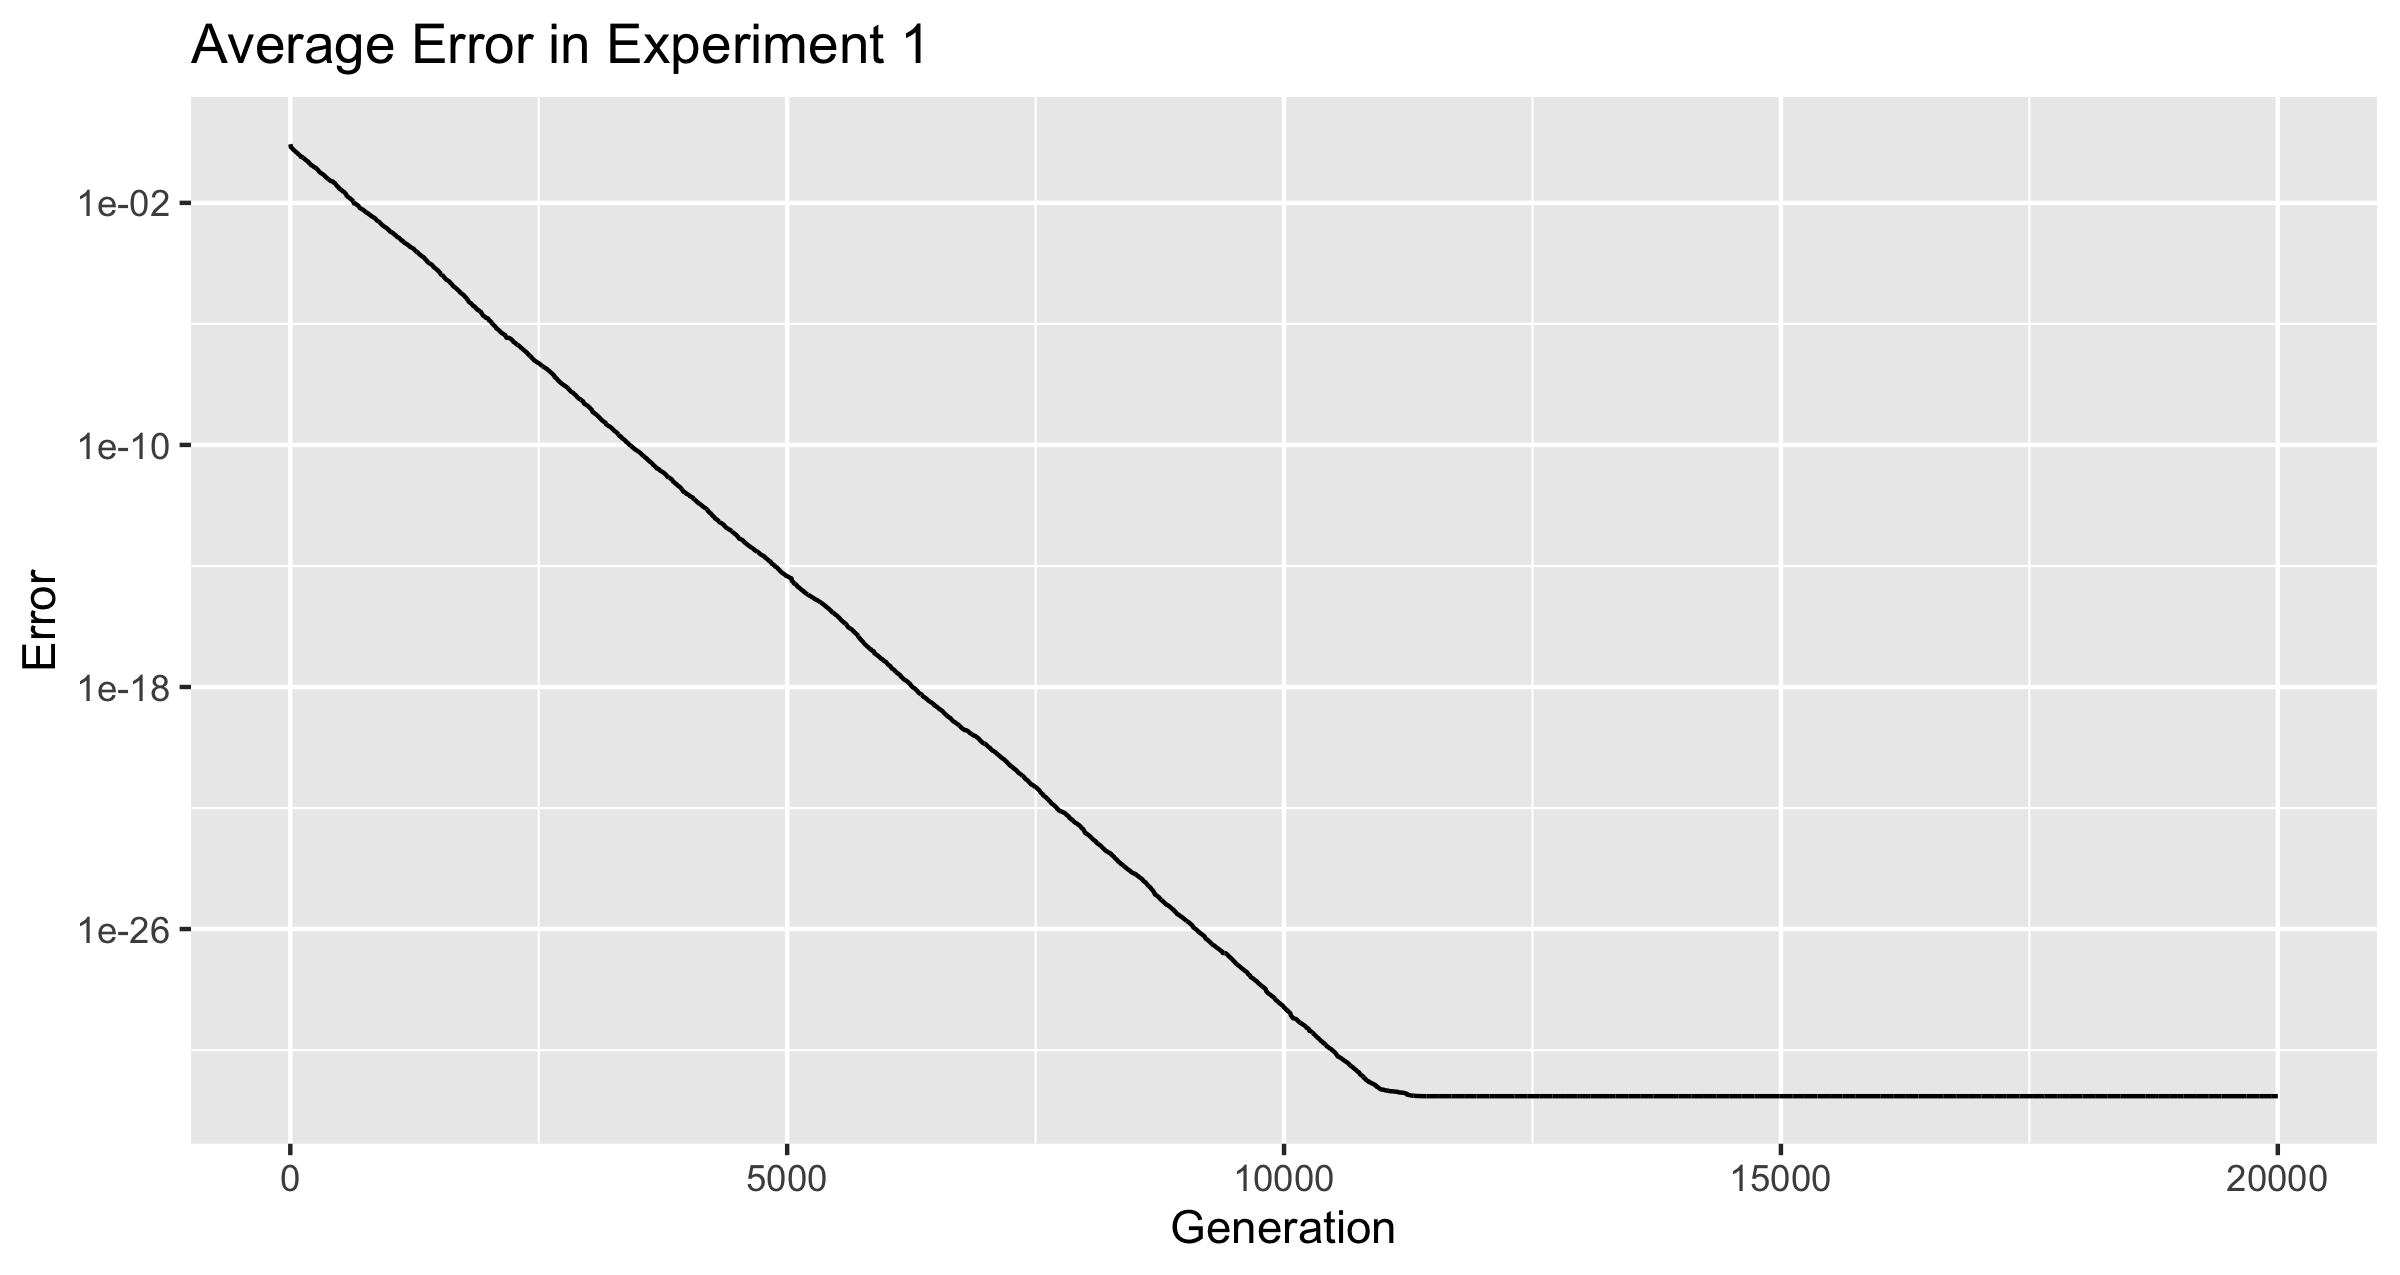
We should not expect any froig to certainly be able to reach 0 error. Javascript numbers are 64-bit double-precision floating-point value (IEEE 754), which corresponds to approximately 15-16 decimal digits of precision. Therefore, once the mutation rate drops below , improvements become impossible for values that are not close to 0.
The lowest total error ever achieved was 2.9905840176445004e-32, first achieved on generation 11474. The average fitness reached a minimum of 2.990584017644493e-32 at generation 11,511. From generation 11,512 through 20,000, the average error never changed, remaining at a value of 2.990584017644494e-32, which only differs from the minimum by the final digit.
The average error rate should have been able to reach the lowest error ever achieved, if that was being selected for, as the number of offspring of this froig should have doubled with each subsequent generation. This discrepancy between the average fitness and the lowest total is explained by our function to calculate the average, which in adding up each value, loses some precision on the last digits. An experiment to replicate this is included in Appendix 4.
These results are all as predicted, and serve as a great control to compare the next experiment with.
Experiment 2: Changing Fitness Function
Using to represent the generation number, we can give an equation for the expected value function that changes across generations as follows:
This will have every expected value go through a full range of -1 to 1 every 10000 generations, due to the shape of the sine function.
Here is what the population looks like at some sample generations. The expected function is shown as a black line. The actions of each of the froigs are shown as bars from the baseline of 0. Each froig action is displayed with a transparent white, so the strong white regions are where many froigs have their outputs stack up, and lighter white regions might be one or only a few froigs having an output right there.
Generation 100  | Generation 1000  |
|---|---|
Generation 2000 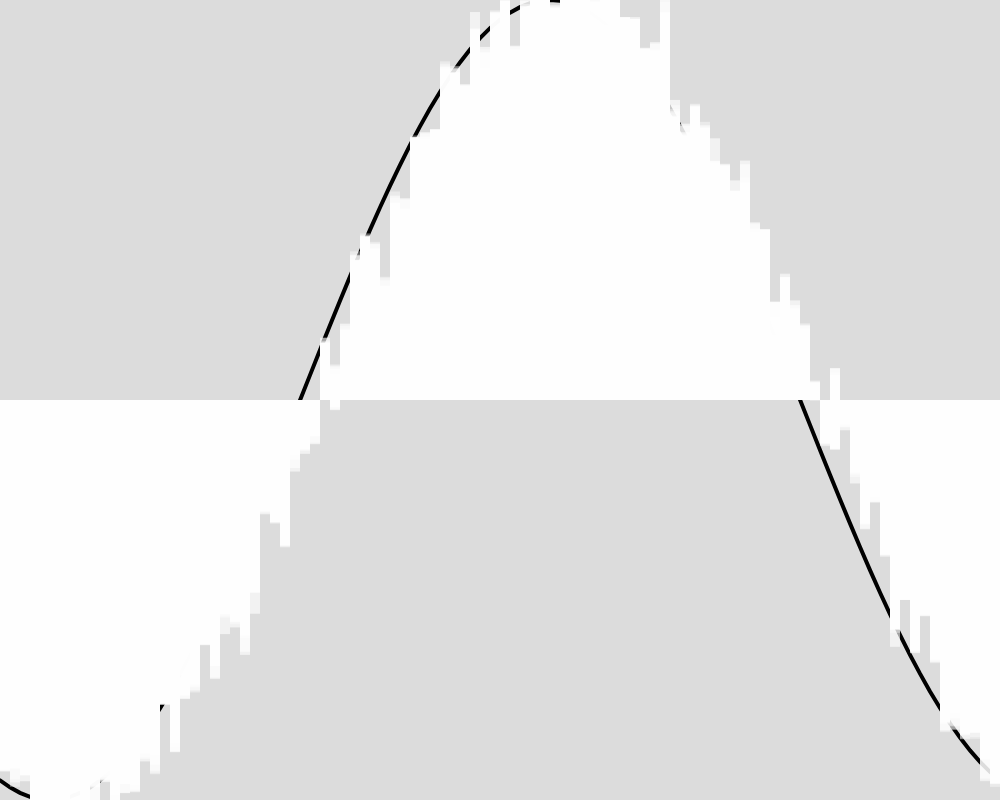 | Generation 3000 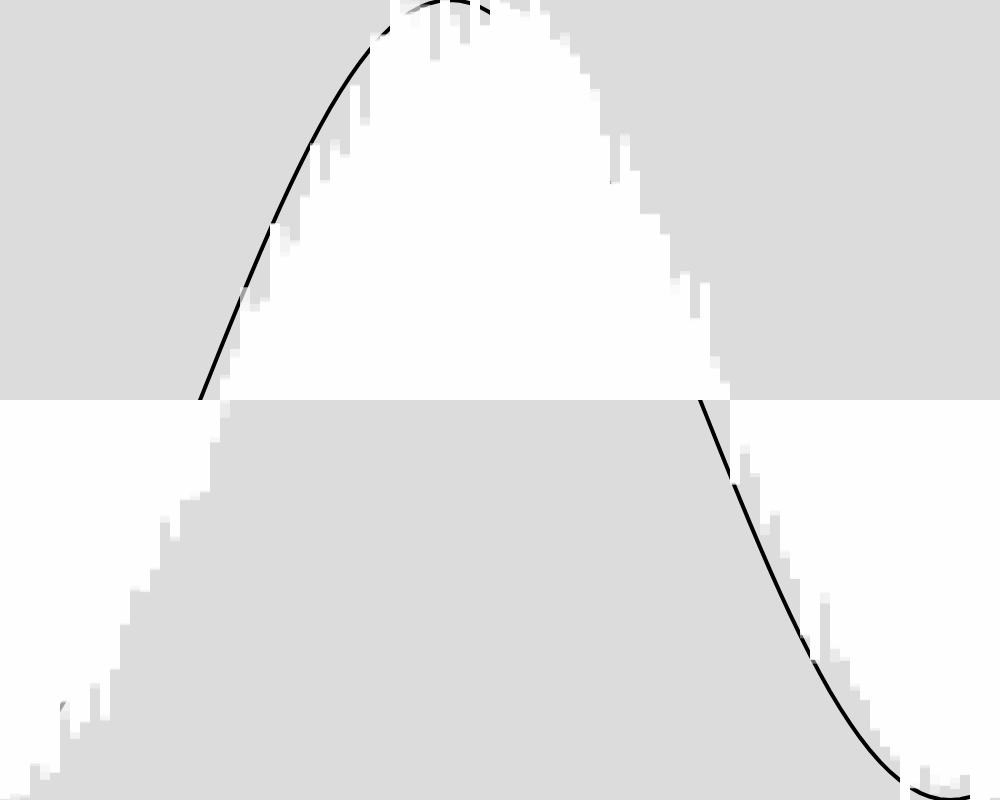 |
Generation 4000 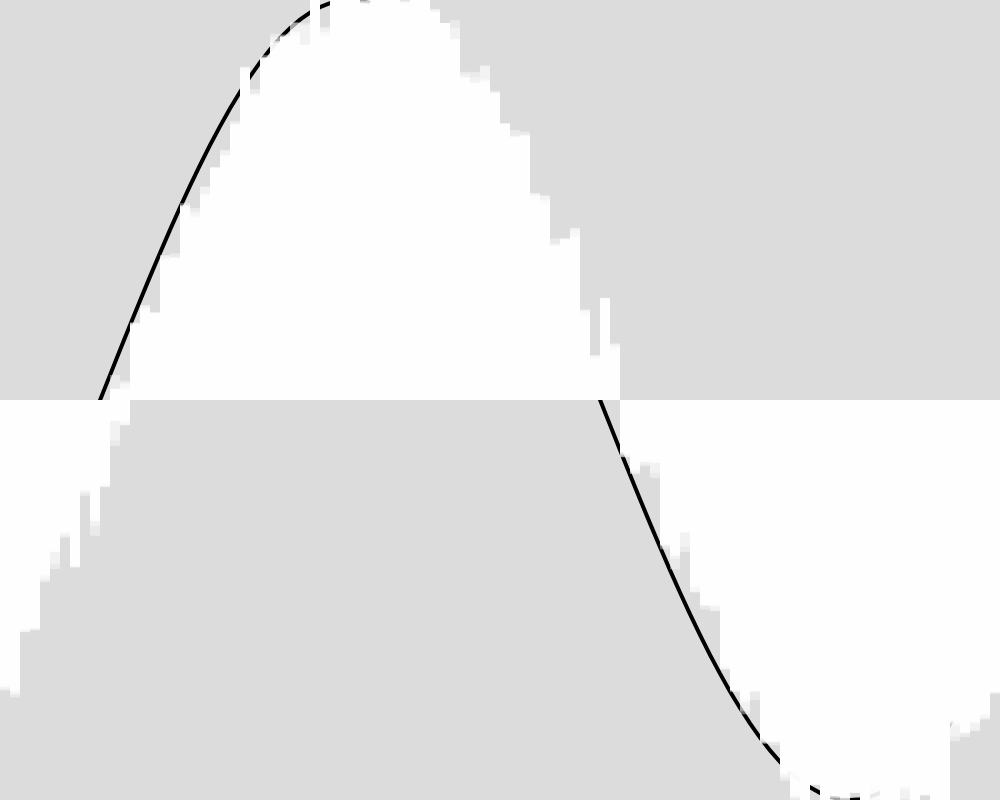 | Generation 5000  |
Generation 10000 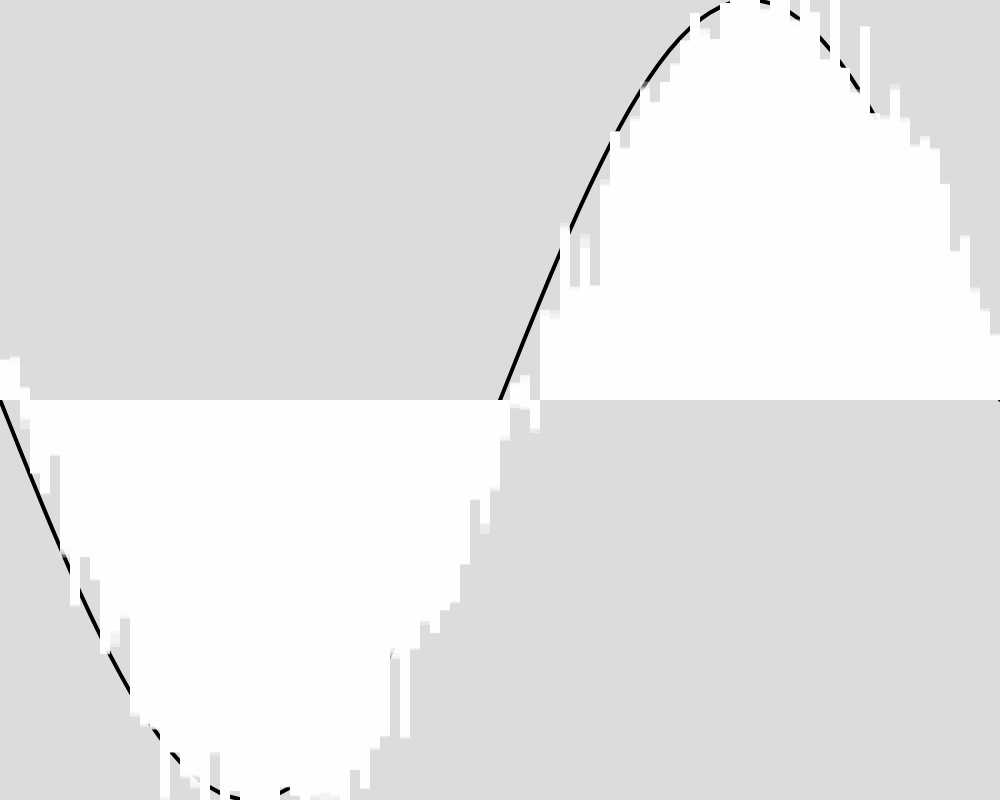 | Generation 20000  |
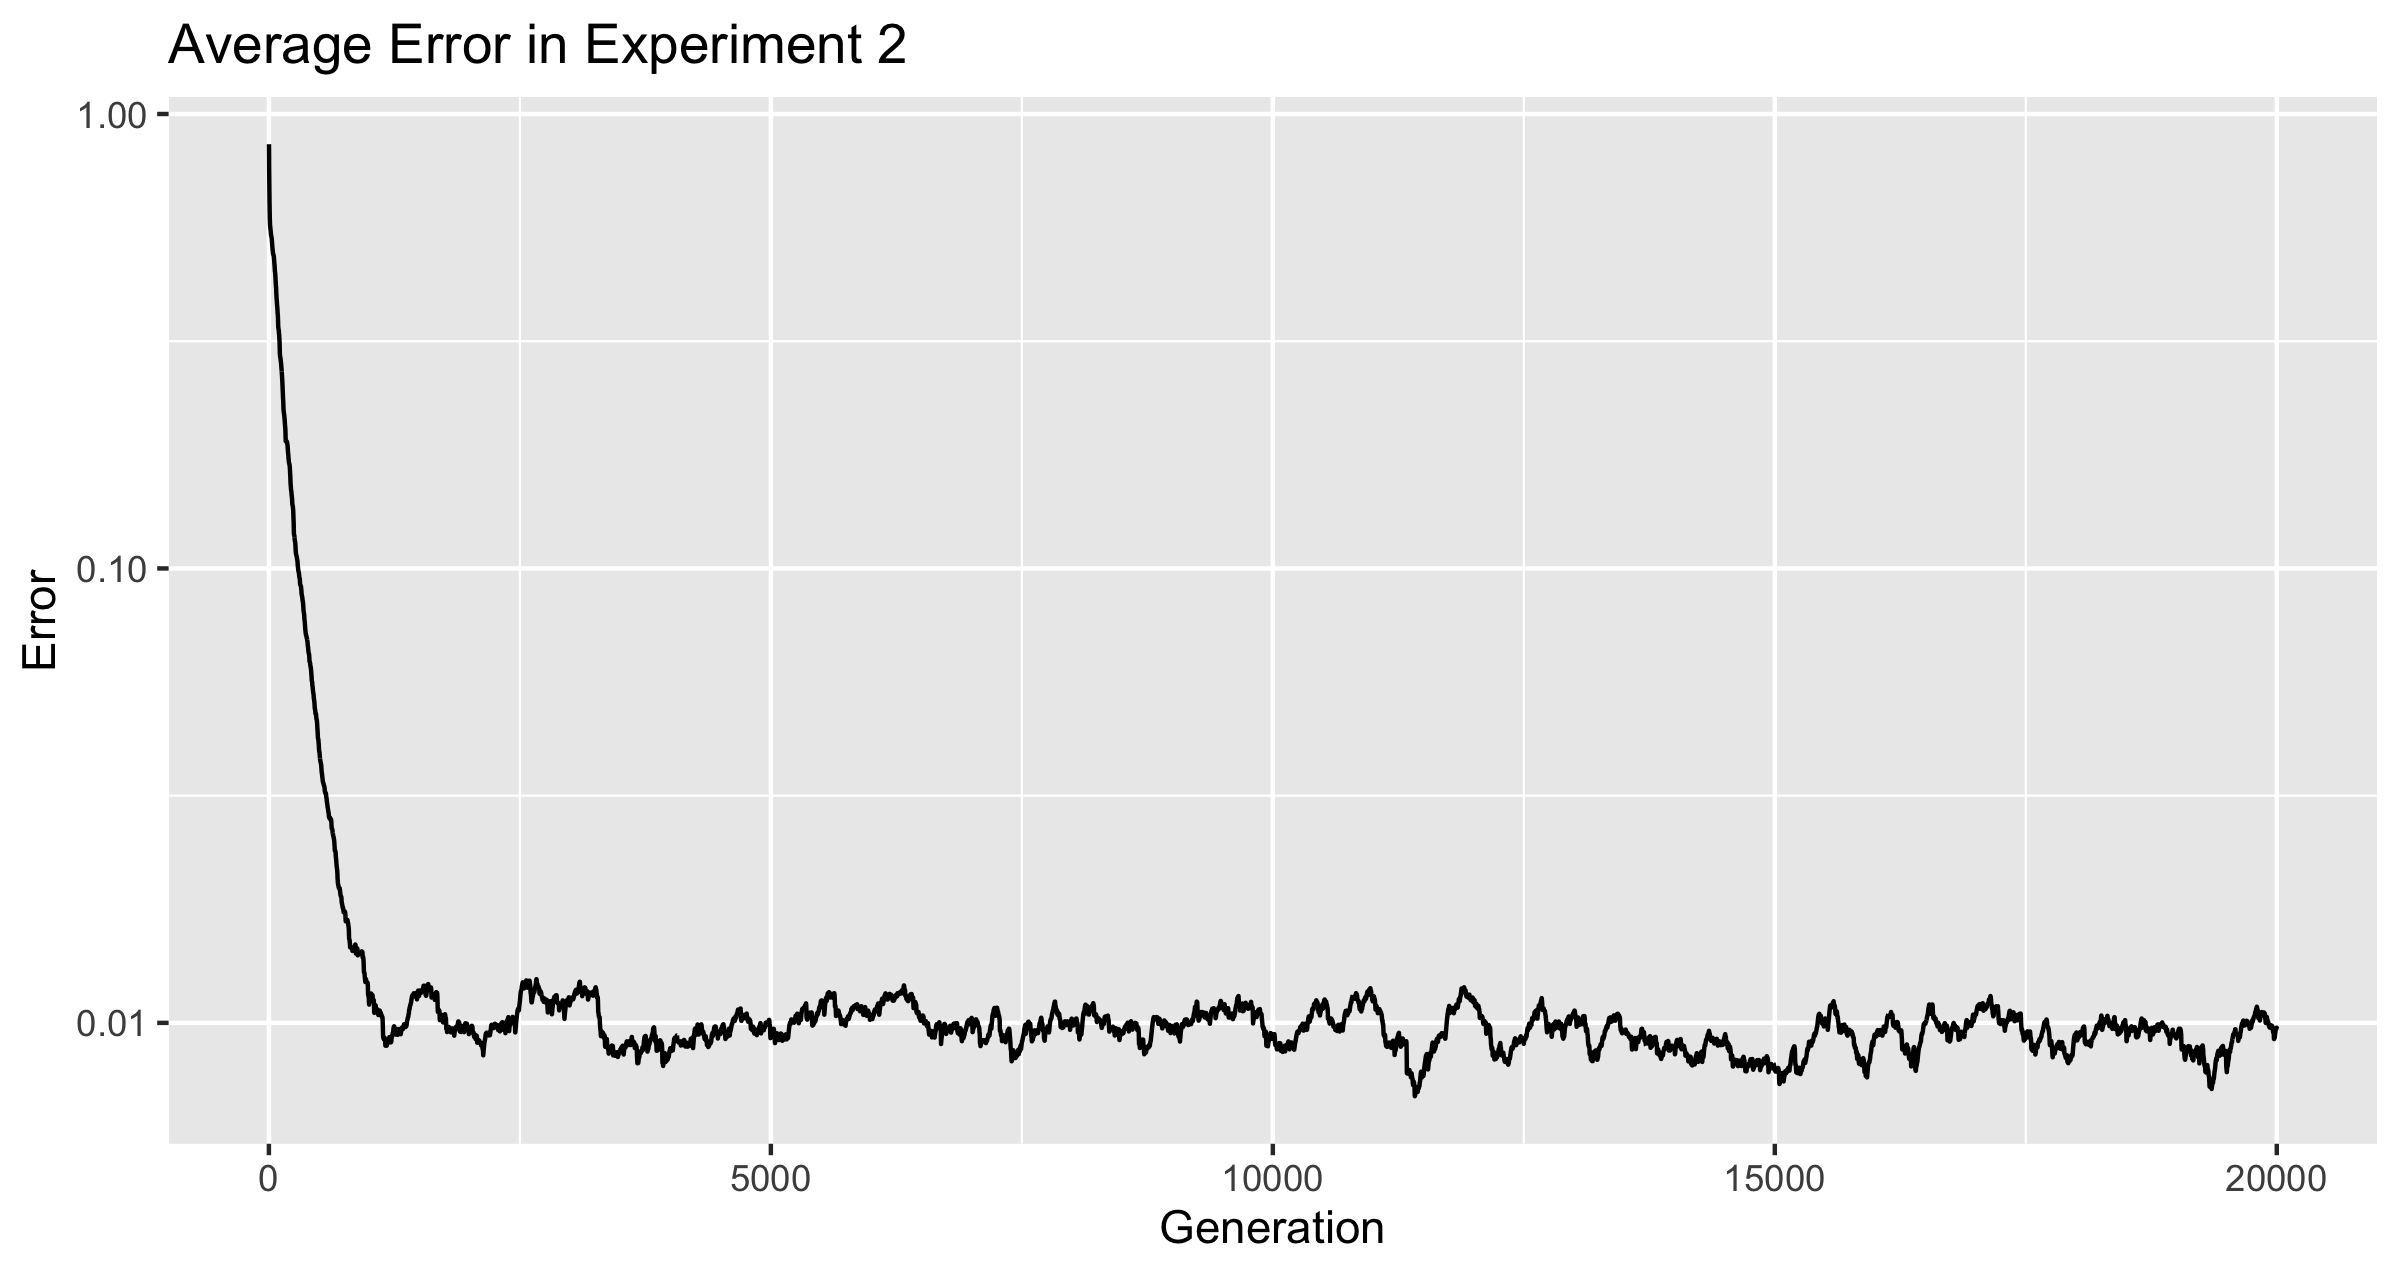
The froig outputs cluster around the expected value function, but never reach it as precisely as in experiment 1. An image for each 100 generations can be found in the data folder for this experiment.
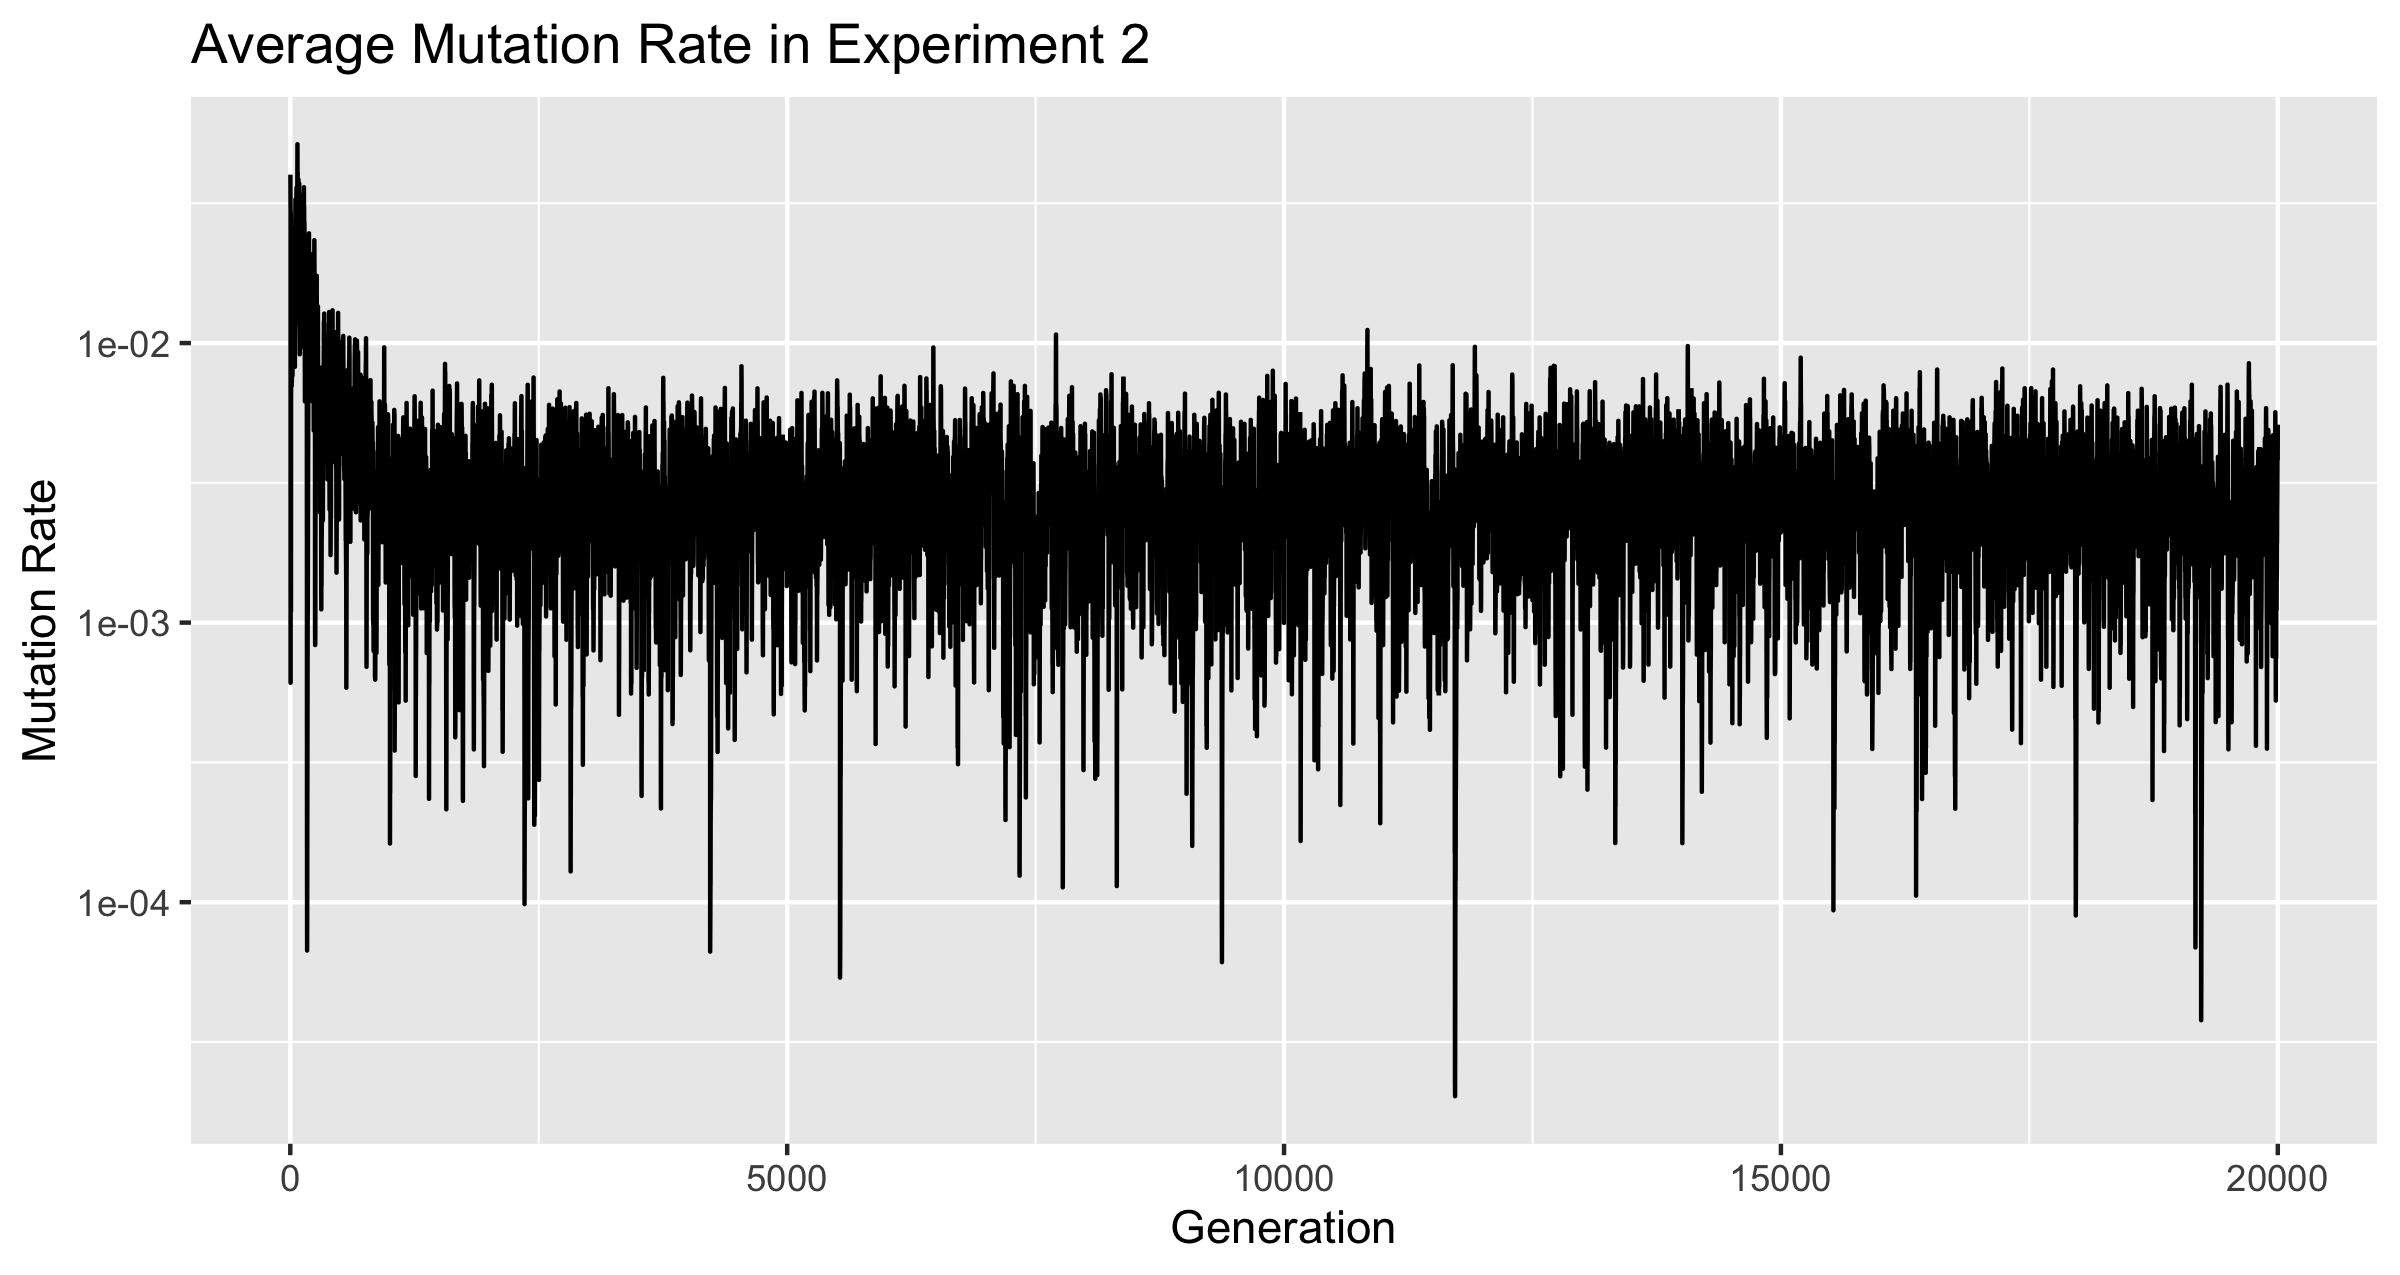
The Mutation Rate never dropped to zero. It did drop from the initial average, and from there it bounced around until generation 20,000. There are several places where the mutation rate dropped suddenly, but it always bounced back. The lowest value ever reached was 2.023250328755403e-05 at generation 11720. Within 16 generations of this, the average mutation rate was back above .
Figure 3
 The discontinuity of the line is an effect of the graphing software, not the data.
Figure 3 plots the mutation rate from the two experiments on a single graph. The two rates originally dropped together at nearly the same rate, but once was reached, only the population of froigs under the conditions of experiment 1 continued to develop a smaller and smaller mutation rate.
Discussion
The results of the experiment confirm the original hypothesis.
Because this contradicts the theory put forward by Dawkins and several others, it is a proper time to propose a new theory. One plausible new theory would be that mutation rate should be proportional to the odds of improving having a higher fitness. If it would be impossible to improve form, then perfect fidelty should be selected for. However, if the environment is changing quickly, or else the species has for whatever reason much room for improvement, then mutation can be done with “intention”.
This theory likely deviates from reality at least around the edges, because …
Implications
To the extent that religious values and languages are replicators, there is perhaps some ability to predict the future from these results.
For example, these results indicate an inclination for English to become increasingly more popular than French, as it is free to mutate whereas there is an attempt to keep French more or less the same over time. In the changing social environment, English may end up with less error to what is trying to be conveyed, and therefore be more useful and therefore more prevalent.
The results would also predict that religions that do not entirely refuse to change might have become more prevalent through time than one that is entirely static. However, even in experiment 2, a very low mutation rate was still selected for. The froigs were not “keen” (pardon the anthropromorphization) to completely reinvent their structure across generations, but those that allowed for slight tweaks from previous generations had success.
It also could potentially have implications for DNA dating. On discussing estimated dates of population splitting between Neanderthals, Denisovans, and Homo Sapiens, David Reich says “These genetic dates depend on estimates of the mutation rate and will change as those estimates become more exact.”^4
It follows that if mutation rates might change when the environment changes, then such calculation might not be so straight forward.
There should be strong hesitancy on taking the results of this experiment alone towards changing any estimates. Froigs are only one instance of replicators. Furthermore, Froigs reproduce asexually whereas humans produce sexually. Thus, a positively-selected-for non-zero mutation rate has still not been shown in sexually reproducing replicators, let along in humans. Still, these results perhaps introduce the idea that the mutation rate of humans should not be assumes to be static, especially as new environments or social conditions are encountered, nor that zero-mutation-rate is selected for. Further research on sexually reproducing replicators and then on biological replicators can word towards deciding how relevant this idea might be in dating prehistoric human population splits, or population splits of other animals.
Furthermore, each gene directly affects only one part of the phenotype. That is, there are no interactions between genes, and thus no complex interactions. One idea that makes sense, though not proven by these results, is that mutation rate should be proportional to the likelihood of a mutation being beneficial. If this were true, then the likelihood of a mutation being beneficial in a froig might be much higher than in a biological (DNA based) replicator, as DNA interact in complex ways.
Further Research
A changing fitness function might be one of the necessary ingredients to the development of sexual reproduction.
Will these results hold if sexual reproduction is used?
References
[1]: Thorndike, E.L., & Barnhart, Clarence L. The World Book Dictionary. World Book, Inc., 1978.
[2]: Dawkins, Richard. The Selfish Gene. 40th Anniversary Edition. Oxford University Press, Oxford, UK, 2016.
[3]: Reich, David. Who We Are and How We Got Here: Ancient DNA and the New Science of the Human Past. First Vintage Books Edition. Vintage Books, a division of Penguin Random House LLC, New York, NY, 2019.
[4]: Atmar, W. “Notes on the Simulation of Evolution.” IEEE Transactions on Neural Networks, vol. 5, no. 1, 1994, pp. 130–147. DOI: 10.1109/72.265967.
[5]: Kimura, Motoo. “On the Evolutionary Adjustment of Spontaneous Mutation Rates.” Genetical Research, vol. 9, no. 1, 1967, pp. 23–34. DOI: 10.1017/S0016672300010284.
Appendix 1: Simulation vs. Experiment
This paper claims to describe an experiment as opposed to a simulation. This experiment was conducted using a computer which is more often used for simulation. Thus this distinction, though semantic, is worth being clarified. According to the World Book Dictionary 1978 edition (\cite{thorndike1978world}), we have the following definitions:
Simulation - the representation or imitation of a physical or social system or its activity by a computer for the purpose of predicting the behavior of the system under certain conditions.
Experiment - a test or trial to find out something.
The events detailed here fall into the later category because the froigs are the objects that are under study. We are not using them as proxy for any real world thing. They exist on a computer, yes, but they are interesting in and of themselves.
They do not need to be representations of replicators because they themselves replicate. These findings, therefore, if not proven erroneous, must be contended with in all future discussions of the dynamics of replicators.
Appendix 2:
The fact that javascript numbers can hit 0 by decreasing logarithmically can be demonstrated by running the following code snippet, which will terminate with .
let x = 1;
let i = 0;
while (x > 0) {
    x/=2;
    i++;
    console.log(i, x);
}
Appendix 3:
The code for this project is hosted here: https://github.com/thetravisweber/sine-evolution-mutation-rate
This experiment can be replicated by running the code. However, this is not a robust replication attempt because any bugs in the code used here will be present in that running.
The git history, (a history of the code) can be found at the same link. The data used in the graphs and discussion of this paper were gathered in between commits 4654e5c and 3c29e8d.
Appendix 4:
function average(arr) {
  let acc = 0;
  for (const val of arr) {
    acc += val;
  }
  return acc / arr.length;
}

// 200 copies of the lowest fitness achieved
const fitnesses = new Array(200).fill(2.9905840176445004e-32);

console.log(average(fitnesses));
Output: 2.990584017644492e-32
Even though we know that the actual average must be 2.9905840176445004e-32 because all of the values are 2.9905840176445004e-32, the calculation is only precise to 13 digits.
It is still unknown why average mutation rate in the experiment settled on 2.9905840176444924e-32, even though it reached 2.990584017644493e-32, while the results of this appendix’s experiment would predict it to be 2.990584017644492e-32. These all differ by their last digit. Subsequent runs of this sub-experiment within subsequent runs of the overall experiment show similar discrepancies, but a precision of 13 of 14 digits is always held.
